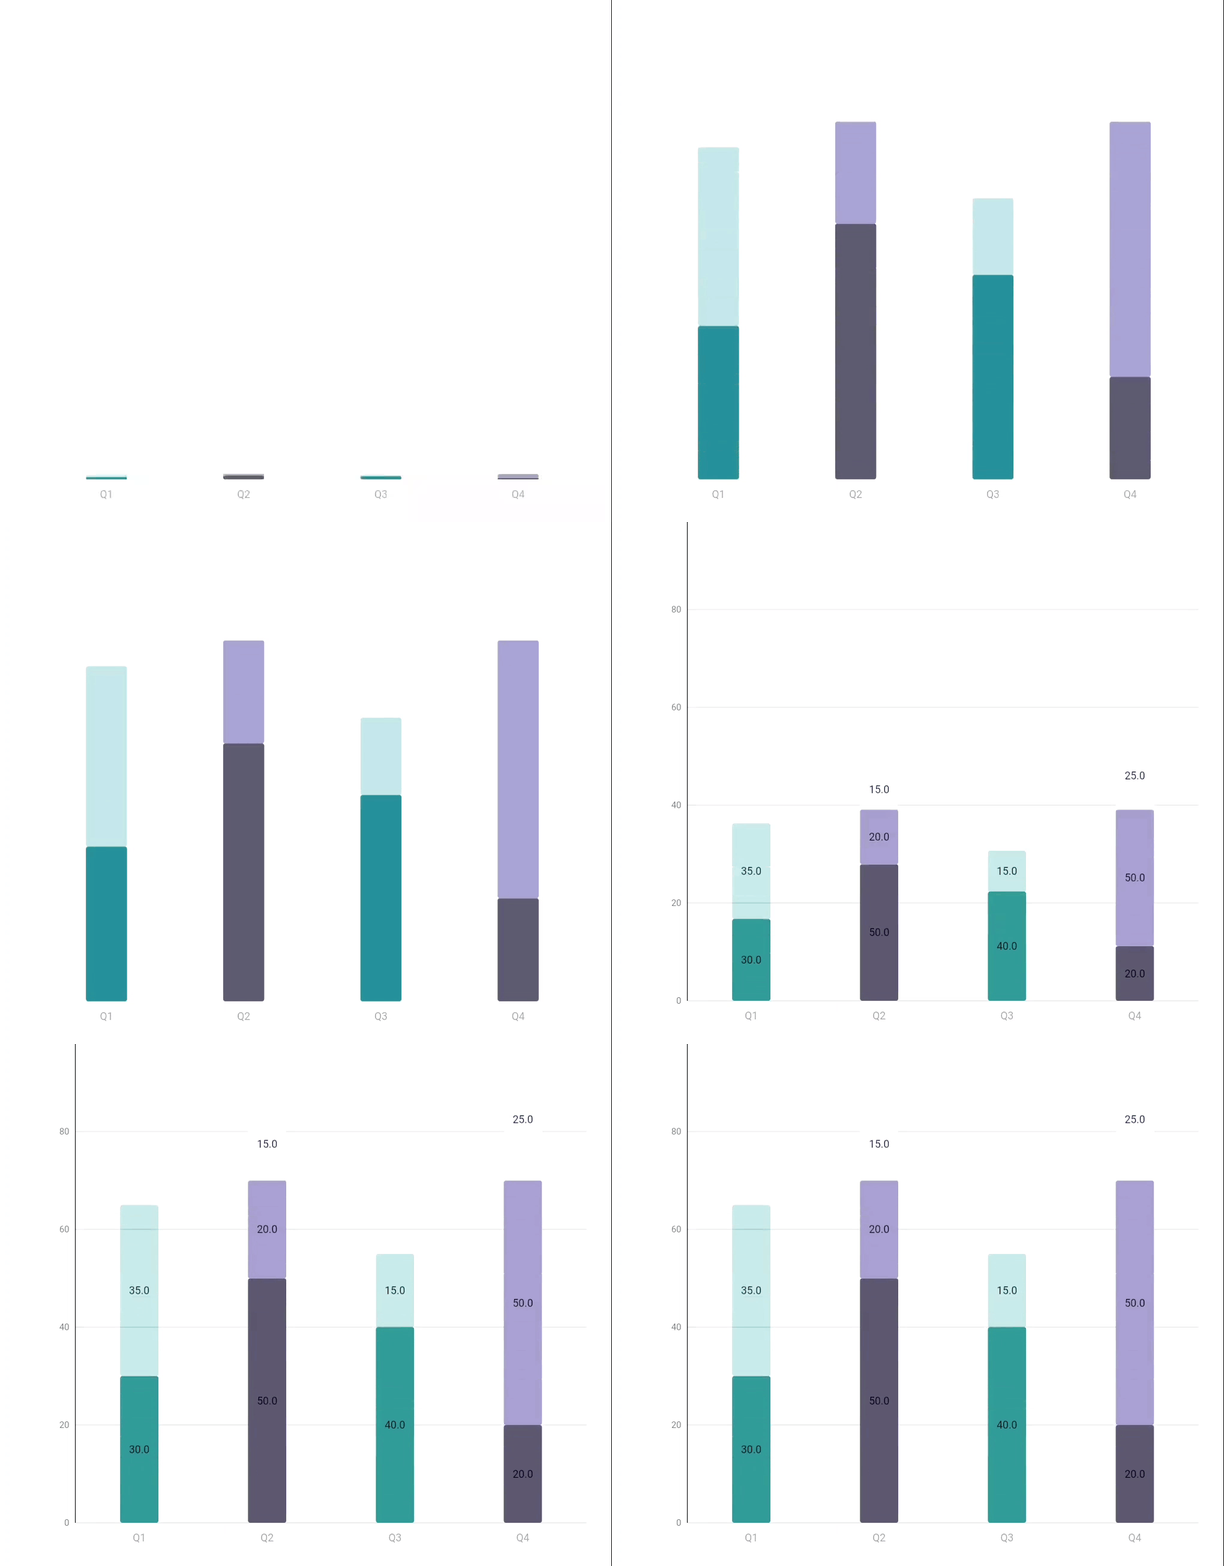
Stacked Bar Chart The Stacked Bar Chart in the Material Charts Flutter package is an exceptional tool for developers looking to create dynamic and informative data visualizations in their Flutter applications. This powerful charting component allows users to visualize multiple data series stacked on top of each other, making it easy to compare parts of a whole across various categories. With its extensive customization options, including color schemes, labels, and interactive features, the Stacked Bar Chart enhances user engagement and provides deeper insights into data composition and trends. Ideal for dashboards, reports, and any application requiring effective data representation, the Stacked Bar Chart is a must-have for Flutter developers aiming to deliver a rich and interactive user experience.
Usage
    import 'package:flutter/material.dart';
    import 'package:material_charts_tests/material_charts.dart';

    final data = [
      const StackedBarData(
        label: 'Q1',
        segments: [
          StackedBarSegment(
              value: 30,
              color: Color.fromRGBO(46, 142, 149, 1),
              label: 'Product A'),
          StackedBarSegment(
              value: 35,
              color: Color.fromRGBO(46, 142, 149, 0.342),
              label: 'Product B'),
        ],
      ),
      const StackedBarData(
        label: 'Q2',
        segments: [
          StackedBarSegment(
              value: 50, color: Color(0xFF605e70), label: 'Product A'),
          StackedBarSegment(
              value: 20, color: Color(0xFFa19dc7), label: 'Product B'),
          StackedBarSegment(
              value: 15, color: Color(0xFFf3f2fe), label: 'Product C'),
        ],
      ),
      const StackedBarData(
        label: 'Q3',
        segments: [
          StackedBarSegment(
              value: 40,
              color: Color.fromRGBO(46, 142, 149, 1),
              label: 'Product A'),
          StackedBarSegment(
              value: 15,
              color: Color.fromRGBO(46, 142, 149, 0.342),
              label: 'Product B'),
        ],
      ),
      const StackedBarData(
        label: 'Q4',
        segments: [
          StackedBarSegment(
              value: 20, color: Color(0xFF605e70), label: 'Product A'),
          StackedBarSegment(
              value: 50, color: Color(0xFFa19dc7), label: 'Product B'),
          StackedBarSegment(
              value: 25, color: Color(0xFFf3f2fe), label: 'Product C'),
        ],
      ),
      // Add more StackedBarData items...
    ];
    MaterialStackedBarChart(
      showGrid: true,
      horizontalGridLines: 5,
      showValues: true,
      data: data,
      width: 400,
      height: 300,
      style: StackedBarChartStyle(
        gridColor: Colors.black,
        // showSegmentLabels: true,
        cornerRadius: 3,
        barSpacing: .7,
        valueStyle: const TextStyle(
          // backgroundColor: Color.fromARGB(68, 255, 255, 255),
          color: Colors.black87,
        ),
        labelStyle: const TextStyle(
          color: Colors.grey,
        ),
        yAxisConfig: YAxisConfig(
          minValue: 0,
          maxValue: 100,
          divisions: 5,
          showGridLines: false,
          labelStyle: TextStyle(
            fontSize: 12,
            color: Colors.grey[600],
          ),
        ),
      ),
    );
Properties StackedBarChartData Class Description StackedBarSegment Represents a single segment in a stacked bar, defined by its value, color, and an optional label. StackedBarData Represents the complete data for a single bar, consisting of multiple segments with a common label. YAxisConfig Configuration class for customizing the Y-axis, including min/max values, grid lines, and label styles. StackedBarChartStyle Configuration class for customizing the appearance of the stacked bar chart, including colors, spacing, and animations.
StackedBarSegment Property Type Description value double The numerical value of the segment contributing to the total. color Color The color used to render this segment in the chart. label String? An optional label to describe the segment, used for tooltips/legends.
StackedBarData Property Type Description label String Label describing the entire bar, often used for X-axis/legend. segments List<StackedBarSegment> List of segments that make up this bar. totalValue double Computes the total value by summing all segment values.
YAxisConfig Property Type Description minValue double? Minimum value displayed on the Y-axis (default: 0). maxValue double? Maximum value displayed on the Y-axis (defaults to largest total). divisions int Number of divisions on the Y-axis (default: 5). showAxisLine bool Whether to display the vertical axis line (default: true). showGridLines bool Whether to display horizontal grid lines (default: true). labelStyle TextStyle? Text style for Y-axis labels. axisWidth double Width allocated for rendering the Y-axis (default: 50.0). labelFormatter String Function(double) Custom formatter for Y-axis values.
StackedBarChartStyle Property Type Description gridColor Color Color of the grid lines (default: Colors.grey). backgroundColor Color Background color of the chart container (default: Colors.white). labelStyle TextStyle? Text style for bar labels. valueStyle TextStyle? Text style for value labels displayed on segments. barSpacing double Spacing between bars as a fraction (default: 0.2). cornerRadius double Corner radius applied to bars (default: 4.0). animationDuration Duration Duration of the animation when rendering bars (default: 1500ms). animationCurve Curve Animation curve applied during rendering (default: Curves.easeInOut). yAxisConfig YAxisConfig? Optional Y-axis configuration for detailed control.
Features 📊 Dynamic Stacking 🎨 Customizable Segment Colors 🏷️ Segment Labels 📏 Adjustable Bar Widths and Spacing 📅 Animation Support 📏 Optional Gridlines 📐 Padding Control 🌈 Gradient and Solid Color Options 🛠️ Custom Y-axis Configuration 📊 Responsive Sizing ← Previous Page: Bar Chart Next Page: Line Chart → 