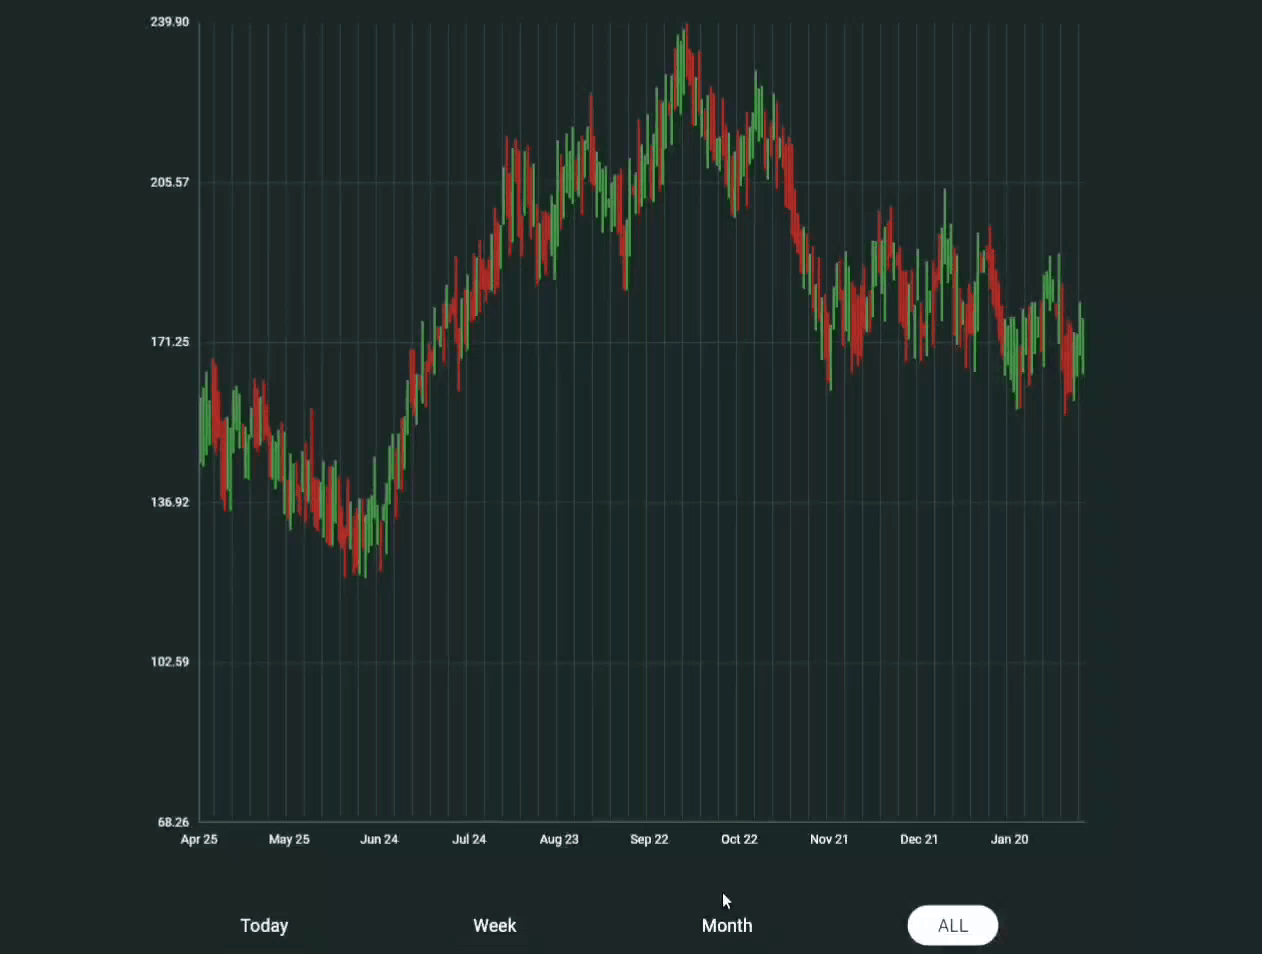
Candlestick Chart The Candlestick Chart in the Material Charts Flutter package is a powerful visualization tool specifically designed for developers looking to represent financial data and market trends in their Flutter applications. This charting solution effectively displays price movements over time, showcasing open, high, low, and close values for each time period, making it ideal for analyzing stock prices, cryptocurrency trends, and other financial metrics. With customizable colors for bullish and bearish candles, interactive tooltips, and smooth animations, the Candlestick Chart enhances user engagement and provides clear insights into market behavior. Perfect for trading platforms, financial dashboards, and any application that requires effective data representation, the Candlestick Chart empowers developers to create a compelling user experience while delivering critical financial information.
Usage import 'package:flutter/material.dart';
import 'package:material_charts_tests/material_charts.dart';
List <CandlestickData> volatileStockData = [
CandlestickData(
date: DateTime(2024, 1, 1),
open: 100,
high: 110,
low: 95,
close: 105,
),
...
];
MaterialCandlestickChart(
data: volatileStockData,
width: 400,
height: 300,
backgroundColor: Color.fromRGBO(39, 50, 51, 1),
style: const CandlestickStyle(
verticalLineColor: Colors.white,
verticalLineWidth: 1,
bullishColor: Color.fromARGB(255, 66, 148, 69),
bearishColor: Color.fromARGB(255, 185, 51, 42),
candleWidth: 2,
spacing: 0.2,
tooltipStyle: TooltipStyle(
backgroundColor: Colors.grey,
textStyle: TextStyle(
fontWeight: FontWeight.w500,
color: Colors.black,
),
borderRadius: 10,
),
),
axisConfig: const ChartAxisConfig(
labelStyle: TextStyle(
color: Colors.white,
fontSize: 10,
fontWeight: FontWeight.w500,
),
priceDivisions: 5,
dateDivisions: 6,
),
showGrid: true,
);Properties CandleStickChart Class Description CandlestickData Represents data for a single candlestick, including opening, high, low, closing prices, and optional volume. TooltipStyle Configuration class for styling tooltips displayed on the chart. CandlestickStyle Configuration class for customizing the appearance of the candlestick chart, including colors and sizes. ChartAxisConfig Configuration for chart axes, including divisions, label styles, and custom formatters. MaterialCandlestickChart The main widget that renders the candlestick chart with data, styles, and configuration options.
MaterialCandlestickChart Property Type Description data List<CandlestickData> List of candlestick data to render. width double Width of the chart. height double Height of the chart. backgroundColor Color? Optional background color for the chart. style CandlestickStyle Style configuration for the chart. axisConfig ChartAxisConfig Axis configuration for the chart. padding EdgeInsets Padding around the chart. showGrid bool Flag to show or hide the grid. onAnimationComplete VoidCallback? Callback executed when the animation completes.
CandlestickData Property Type Description date DateTime The date/time of the candlestick. open double The opening price of the candlestick. high double The highest price during the candlestick period. low double The lowest price during the candlestick period. close double The closing price of the candlestick. volume double? Optional volume data associated with the candlestick. isBullish bool Indicates whether the candlestick is bullish (green) or bearish (red).
TooltipStyle Property Type Description backgroundColor Color Background color of the tooltip. borderColor Color Color of the tooltip border. borderRadius double Radius for rounded corners of the tooltip. textStyle TextStyle Text style used for displaying tooltip content. padding EdgeInsets Padding inside the tooltip.
CandlestickStyle Property Type Description bullishColor Color Color used for bullish candlesticks. bearishColor Color Color used for bearish candlesticks. candleWidth double Width of the candlestick. wickWidth double Width of the candlestick wick. spacing double Spacing between candlesticks. animationDuration Duration Duration of the animation for rendering the candlestick. animationCurve Curve Animation curve for rendering. verticalLineColor Color Color for the vertical line indicating the current price. verticalLineWidth double Width of the vertical line. tooltipStyle TooltipStyle Styling configuration for the tooltip.
ChartAxisConfig Property Type Description priceDivisions int Number of price divisions on Y-axis. dateDivisions int Number of date divisions on X-axis. labelStyle TextStyle? Text style for axis labels. yAxisWidth double Width reserved for the Y-axis. xAxisHeight double Height reserved for the X-axis. priceFormatter String Function(double) Custom formatter for price labels. dateFormatter String Function(DateTime) Custom formatter for date labels.
Features 📊 Interactive Candlestick Visualization 📈 Bullish and Bearish Color Coding 🎨 Customizable Candle and Wick Width 📅 Date and Price Axis Configuration 🌈 Tooltip Styling Options 🔄 Animation Support with Curved Transitions 📏 Adjustable Spacing Between Candles 📊 Optional Gridlines for Clarity 📏 Configurable Y-axis and X-axis Dimensions 🖌️ Custom Price and Date Formatting 📉 Vertical Line Indicators ← Previous Page: Gantt Chart Next Page: Area Chart →