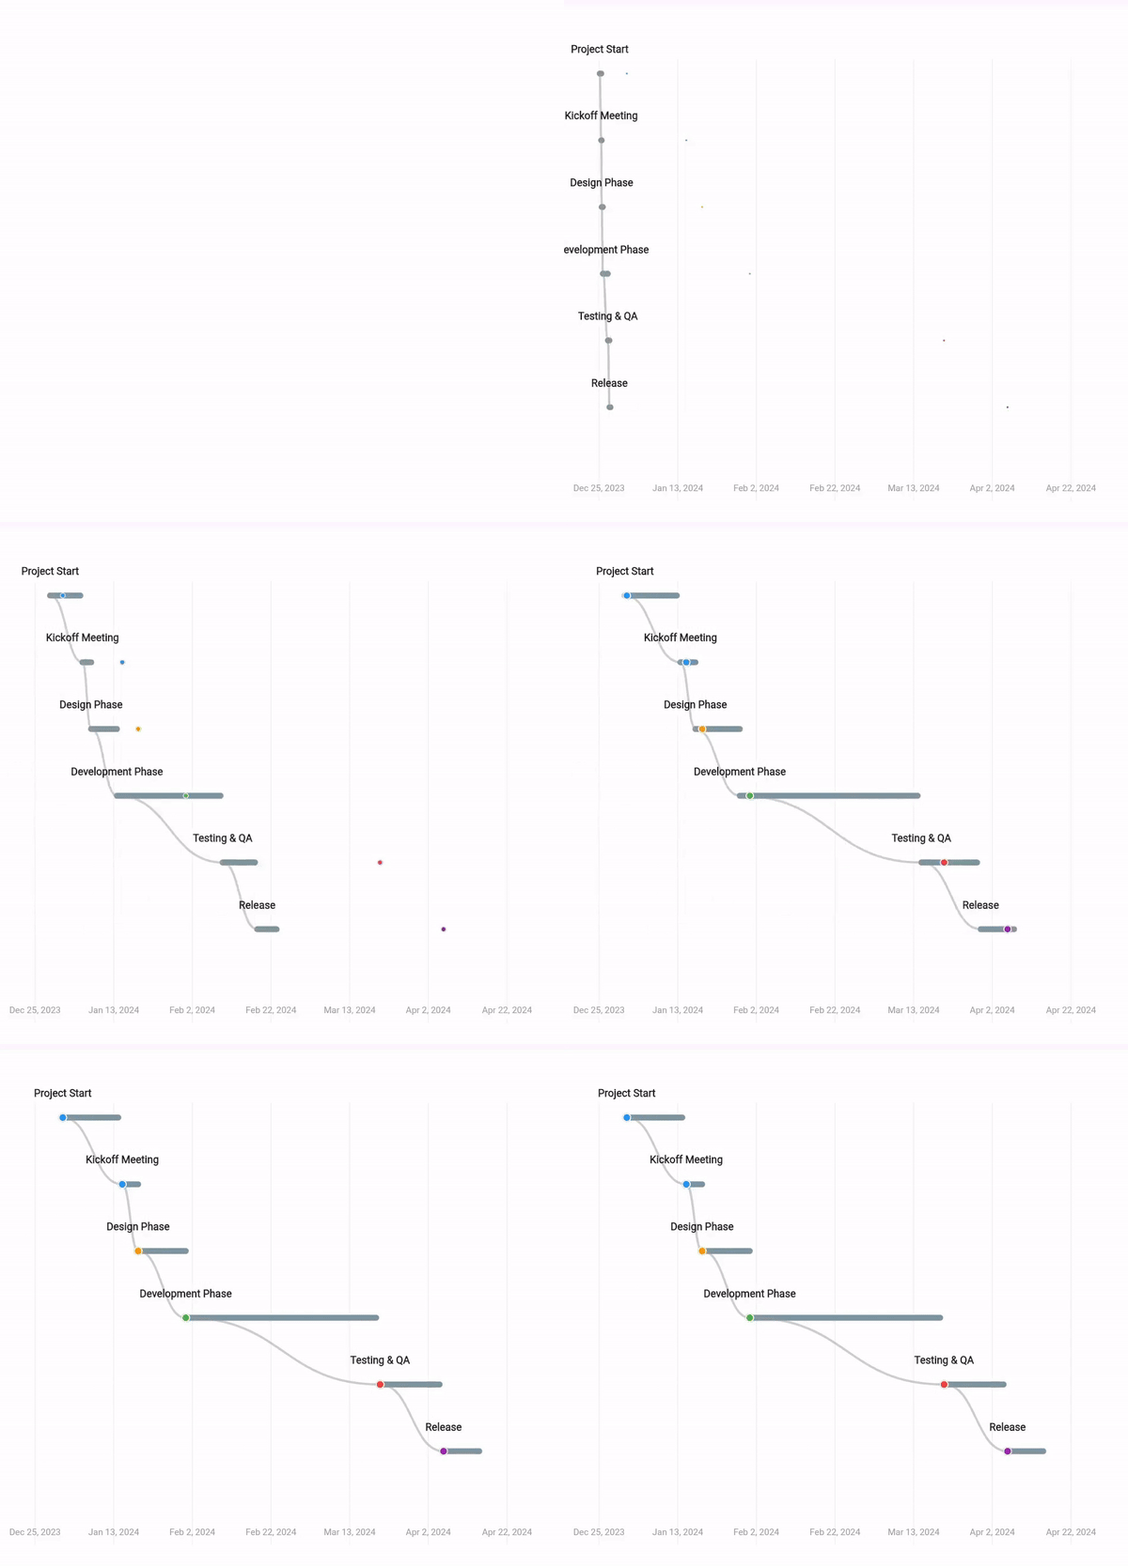
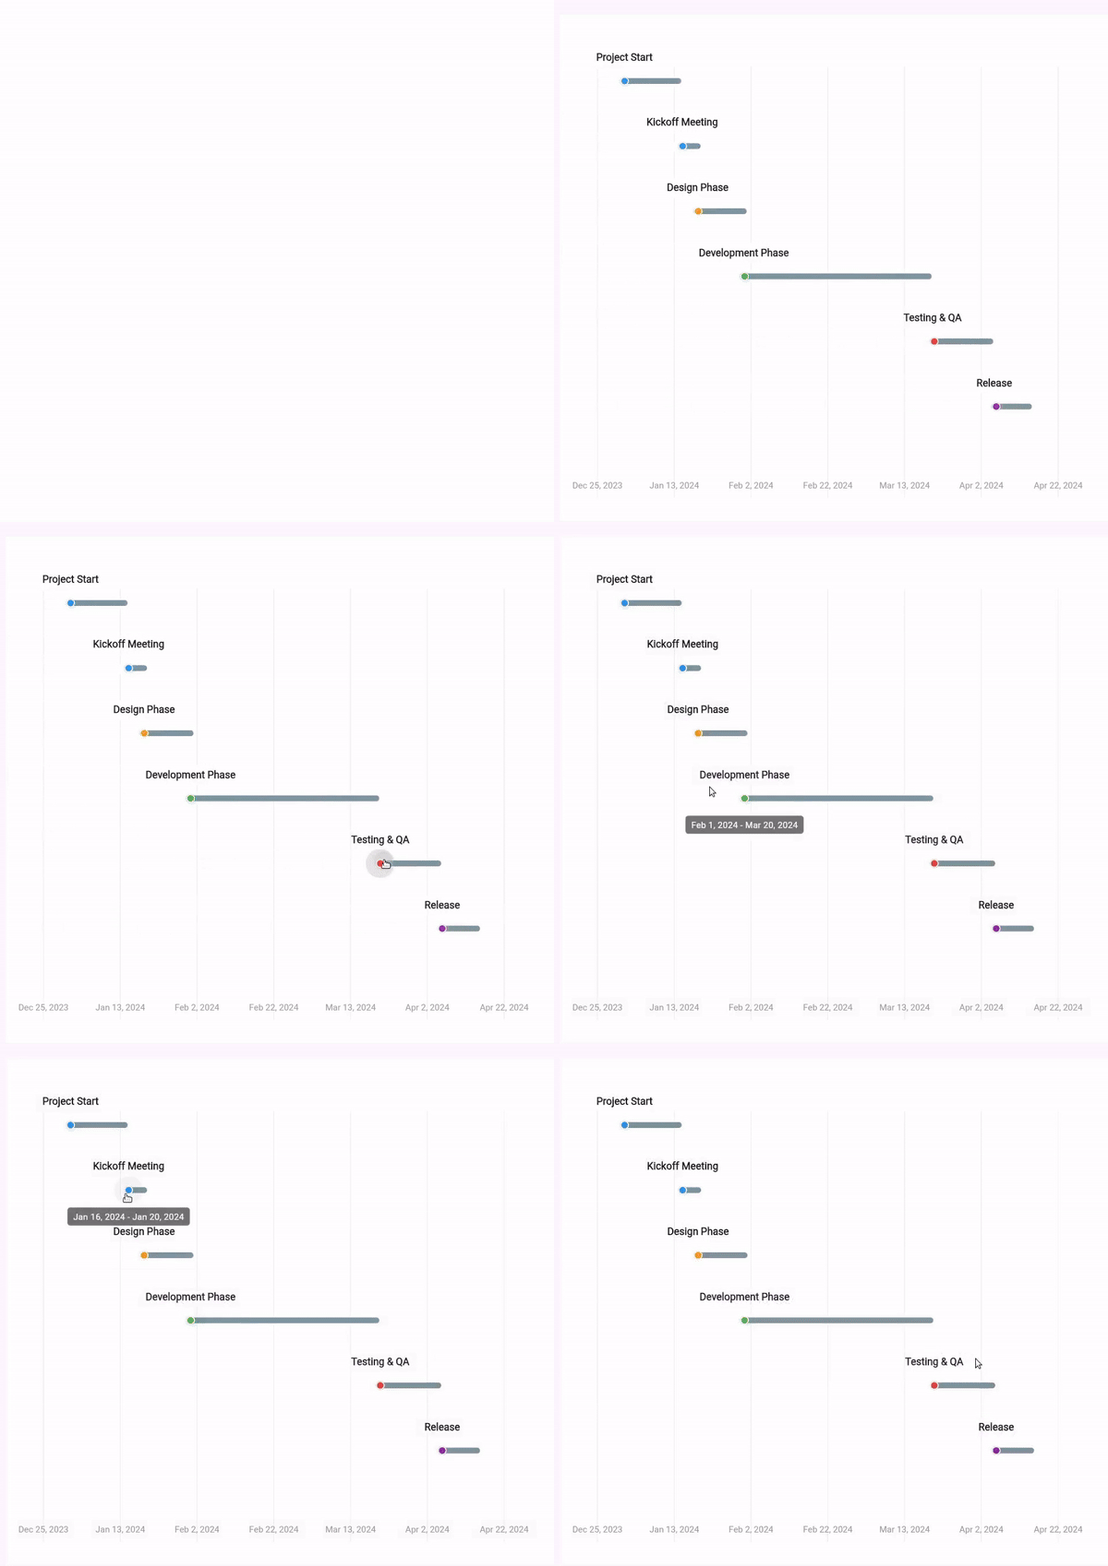
Gantt Chart The Gantt Chart in the Material Charts Flutter package is an invaluable tool for developers seeking to visualize project timelines and task progress within their Flutter applications. This powerful charting solution allows users to represent tasks along a timeline, making it easy to track project milestones, deadlines, and dependencies at a glance. With customizable colors, interactive elements, and the ability to display detailed task information, the Gantt Chart enhances project management and collaboration. Ideal for project management tools, scheduling applications, and any scenario where task visualization is crucial, the Gantt Chart in the Material Charts package empowers developers to deliver a rich and informative user experience while effectively communicating project status and timelines.
Usage import 'package:flutter/material.dart';
import 'package:material_charts_tests/material_charts.dart';
MaterialGanttChart exampleChart() {
// Example timeline data points
final timelineData = [
GanttData(
startDate: DateTime(2024, 1, 1),
endDate: DateTime(2024, 1, 15),
label: 'Project Start',
description: 'Initial project planning phase',
color: Colors.blue,
icon: Icons.start,
tapContent:
'Additional details for the project start phase...', // Optional tap content
),
GanttData(
startDate: DateTime(2024, 1, 16),
endDate: DateTime(2024, 1, 20),
label: 'Kickoff Meeting',
description: 'Project initiation and goal setting.',
color: Colors.blue,
icon: Icons.event,
),
GanttData(
startDate: DateTime(2024, 1, 20),
endDate: DateTime(2024, 2, 1),
label: 'Design Phase',
description: 'UI/UX design and prototype creation.',
color: Colors.orange,
icon: Icons.design_services,
),
GanttData(
startDate: DateTime(2024, 2, 1),
endDate: DateTime(2024, 3, 20),
label: 'Development Phase',
description: 'Implementation of core features.',
color: Colors.green,
icon: Icons.code,
),
GanttData(
startDate: DateTime(2024, 3, 21),
endDate: DateTime(2024, 4, 5),
label: 'Testing & QA',
description: 'Bug fixing and quality checks.',
color: Colors.red,
icon: Icons.bug_report,
),
GanttData(
startDate: DateTime(2024, 4, 6),
endDate: DateTime(2024, 4, 15),
tapContent: "Tap",
label: 'Release',
description: 'Deployment and client delivery.',
color: Colors.purple,
icon: Icons.rocket_launch,
),
];
// Timeline chart styling
const style = GanttChartStyle(
lineColor: Color.fromRGBO(96, 125, 139, 1),
lineWidth: 8,
pointRadius: 6,
connectionLineWidth: 3,
showConnections: true,
pointColor: Colors.blue,
connectionLineColor: Colors.grey,
backgroundColor: Colors.white,
labelStyle: TextStyle(
fontSize: 14, fontWeight: FontWeight.bold, color: Colors.black87),
dateStyle: TextStyle(fontSize: 12, color: Colors.grey),
animationDuration: Duration(seconds: 2),
animationCurve: Curves.easeInOut,
verticalSpacing: 90.0, // Adjust spacing for readability
// horizontalPadding: 120.0,
);
// Create the timeline chart widget
return MaterialGanttChart(
data: timelineData,
width: 700,
height: 800,
style: style,
onPointTap: (point) {
debugPrint('Tapped on ${point.label}');
},
);
}
Properties GanttData Property Type Description Default startDate DateTime Start date of the task Required endDate DateTime End date of the task Required label String Name or label of the task Required description String? Optional description of the task null color Color? Color used to represent the task null icon IconData? Icon associated with the task null tapContent String? Content displayed when tapping the task null
GanttChartStyle Property Type Description Default lineColor Color Color of the timeline lines Colors.blue pointColor Color Color of data points along the timeline Colors.blue connectionLineColor Color Color of connecting lines between tasks Colors.grey backgroundColor Color Background color of the chart Colors.white labelStyle TextStyle? Text style for task labels null dateStyle TextStyle? Text style for date labels null descriptionStyle TextStyle? Text style for task descriptions null lineWidth double Thickness of the timeline lines 2.0 pointRadius double Radius of data points 4.0 connectionLineWidth double Width of connecting lines 1.0 animationDuration Duration Duration of animation transitions Duration(milliseconds: 1500) animationCurve Curve Curve used for animations Curves.easeInOut showConnections bool Whether to display connections between tasks true dateFormat DateFormat? Format for displaying dates null verticalSpacing double Space between timeline rows 120.0 horizontalPadding double Padding between tasks and chart boundaries 32.0 labelOffset double Offset for task labels 25.0 timelineYOffset double Offset for the vertical position of the timeline 60.0
Features 🗓️ Task Timeline Visualization 📊 Interactive Task Bars 🏷️ Customizable Labels 🔄 Drag-and-Drop Functionality 🎨 Custom Color Schemes 📅 Date Range Filtering 🕒 Animation Support ♿ Accessibility Support 🎯 Highlighting Current Tasks 🌟 Custom Milestones ← Previous Page: Hollow Semi Circle/MeterChart Next Page: Candlestick Chart → 
